COMEX GOLD OPTIONS — GAMMA LEVELS


4 KEY INSTITUTIONAL LEVELS
TRADINGVIEW INDICATOR INPUTS
Enter into Pine Script Pro HUD V38/V39 or use 1-click Copy
EXPECTED VOLATILITY RANGE
1-SIGMA (16% IV)
MACRO MOVE (43 DTE)
±$230.14
$3960.5 — $4420.7
INTRADAY SESSION MOVE (1-DAY)
±$35.10
$4155.5 — $4225.7
AI SMART ADVISOR
◆ NEUTRAL
Live Spot: -- · Confidence: --%
AI advisor loading analysis...
Evaluating COMEX gold dealer positioning and gamma strike concentration...
Key Level: --
--
Generated via Gemini AI · Educational analysis only, not financial advice.
Current Spot: $4190.60
Call Wall Dist: +$309.40 (+7.38%)
Put Wall Dist: -$190.60 (-4.55%)
Flip Dist: +$39.50 (+0.94%)
GOLD (XAU/USD) & OPTIONS GAMMA CONFLUENCE
XAU/USD Continuous • 🔒 FROZEN BENCHMARK DATA (FREE ACCESS)
Traded COMEX gold price action overlaid with institutional gamma walls, flip pivot, and near-spot open interest magnets.
🎯 Peak OI in near-spot window (--)
HOVER BAR:
O: --
H: --
L: --
C: --
Bar Chg (C−O): --
🔒 FROZEN BENCHMARK: $4107.90
📅 Levels As Of CME Settle: -- ($--)
⚡ Basis: -$16.37 (Spot Converted)
Candles Through: --
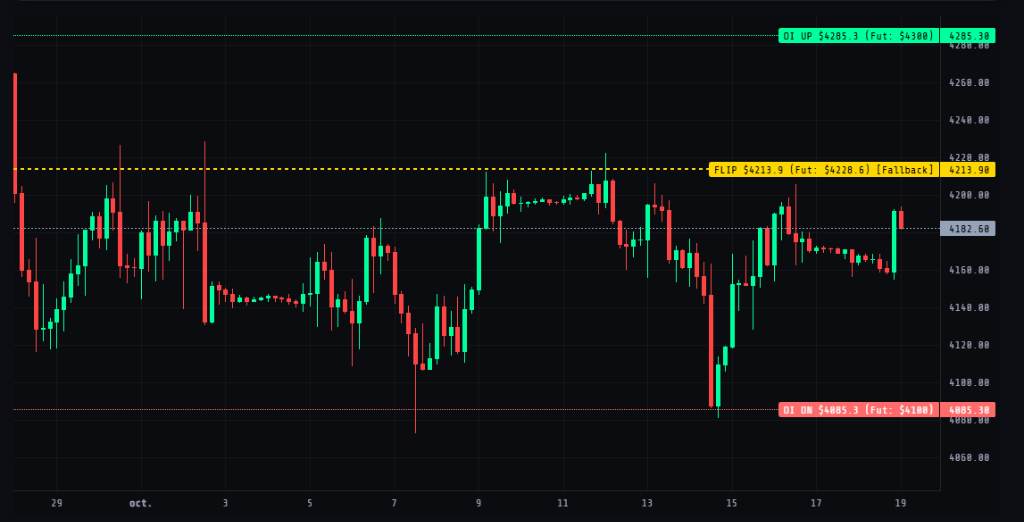
Loading COMEX Gold Futures Candles...
NEAR-SPOT OPEN INTEREST & GEX — 30 STRIKES AROUND SPOT (OGZ26 Dec 2026)
Bilateral Put & Call gamma exposure with institutional Call Wall, Put Wall, and Zero Gamma Pivot
⚡ Gamma Exposure (GEX) Distribution Across Active Strikes
Bilateral Call & Put dealer hedging exposure profile across strikes with spot, flip, and peak OI corridor anchors
🔒 FROZEN BENCHMARK
VALUES IN NET GEX / 1% MOVE
OGZ26
Data & Methodology Disclaimer: Gamma levels are calculated from official CME COMEX Gold options settlement data (Product 437 / 192 OOF). Call Wall is defined as Resistance Ceiling (strikes ≥ Spot) and Put Wall as Support Floor (strikes ≤ Spot) to isolate directional dealer hedging magnet zones. Updated daily after official CME settlement release. IV assumption: 16% annualized (v1 baseline — live IV in v2). Analytical data only, not financial advice.